ConceptViz
AI scientific chart generatorDescribe a chart, download it in seconds
Highlights
What you can do with it
- A teacher generates a labeled plant cell diagram for a biology lesson
- A researcher draws a ray diagram for a physics report
- A student builds a plant cell illustration for an assignment
How to use it
- 1 Open the ConceptViz site and describe the chart you need
- 2 Choose options such as labels, color or black and white, and level
- 3 Click generate and wait a few seconds
- 4 Download the high resolution chart for printing or slides
Who it is for
Pros
- No drawing skill required to get a usable figure
- Multiple disciplines and complexity levels in one tool
- A free plan lets you test it before paying
Limitations
- The free plan only includes three credits, so regular use needs a paid plan
- Free credit allowances and prices can change
- Complex or unusual diagrams may need several attempts to look right
What ConceptViz is
ConceptViz is an AI driven chart generator built for teachers and researchers. Instead of drawing a figure by hand or hunting for a usable image, you describe what you need in plain language and the tool returns a scientific chart, a biological illustration, or a worksheet graphic. It supports several disciplines, including physics, biology, chemistry, geospatial science, and mathematics, and it adjusts to different complexity levels so the same description can serve a middle school class or a research paper. Output can be produced with labels or without, which is useful when you want a blank version for a quiz. Charts download in high resolution so they stay clear when printed or projected. A free plan includes three free credits, and paid teacher plans are listed at 14.9 and 29.9 dollars per month.
What you can do with it
- Describe a chart in plain language and get a finished figure.
- Generate labeled and unlabeled versions of the same diagram.
- Produce biological illustrations, physics diagrams, and worksheet art.
- Work across several school subjects and difficulty levels.
- Download high resolution files for printing, projection, or digital worksheets.
Who it is for
- Teachers preparing lesson visuals, handouts, and worksheets.
- Researchers who need accurate figures for papers and reports.
- Students building study materials and diagrams for assignments.
- Schools that want consistent visual style across teaching materials.
What to watch out for
The free plan only carries three credits, so anyone making figures weekly will need a paid plan, and prices or allowances can change. Scientific accuracy is the part to watch: generated diagrams are a starting point and should be checked against a textbook before they go in front of a class. Unusual or highly specific diagrams often need several attempts and a more detailed description before they look right.
FAQ
Is there a free version?
Yes. There is a free plan that includes three free credits.
What subjects does it cover?
Physics, biology, chemistry, geospatial science, and mathematics, at different complexity levels.
Can I get a version without labels?
Yes. You can choose labeled or unlabeled output when you describe the chart.
Why it is free
What the official page says: free planfree credits
Free limits, trial length and features are decided by the official site and can change at any time.
Product preview
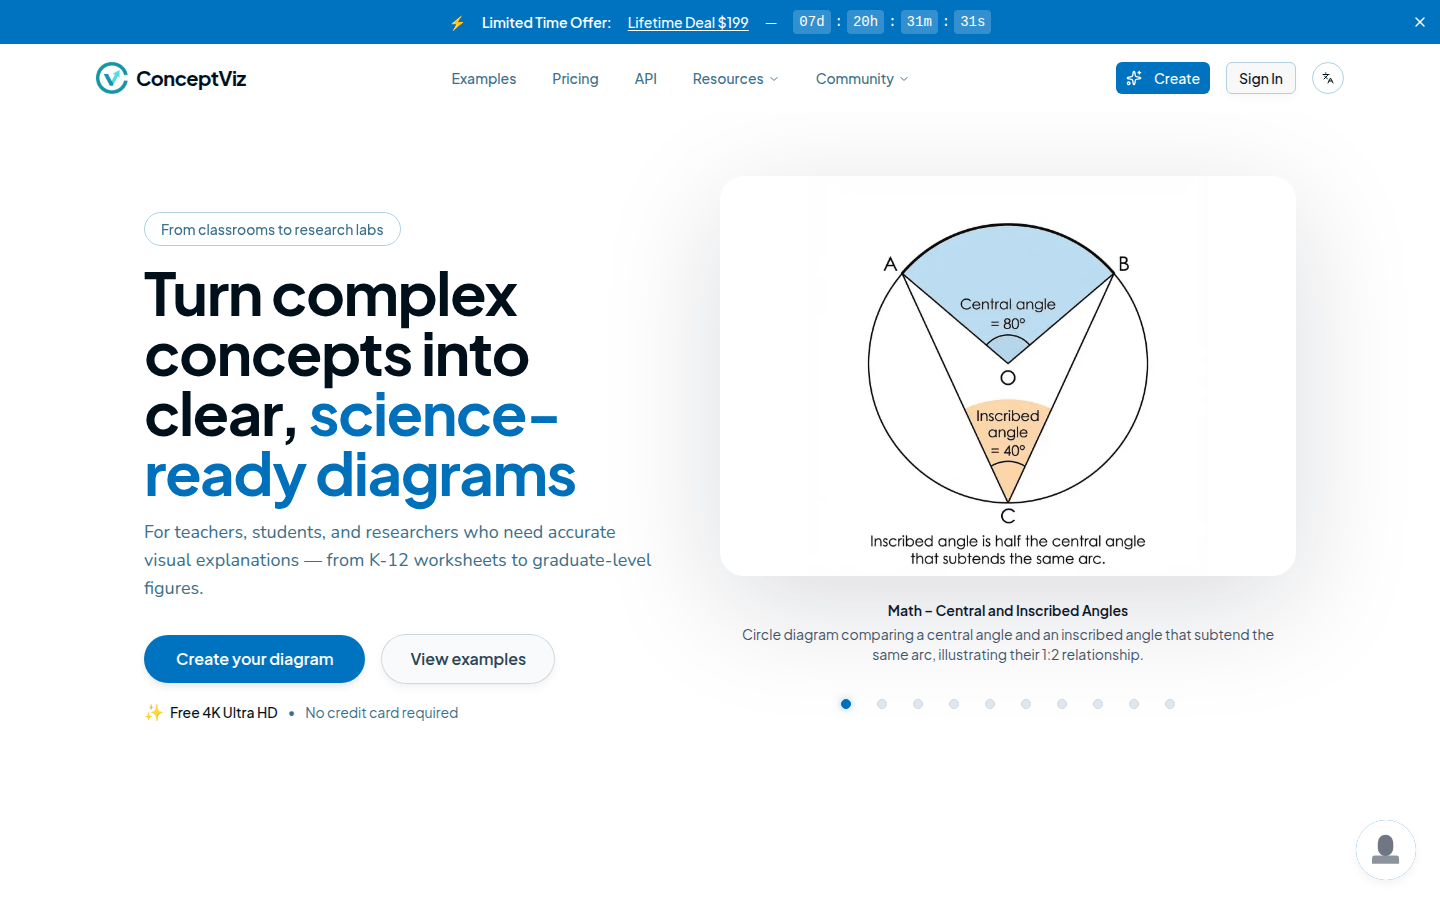
Screenshot archived from the listing page, for preview only.